|
LVDrop
6 and later includes the following features and functions:
Main Window
Multiple
studies open at once
New diagramming engine
Free form diagramming
Transformers
Draw
multiple Transformers
Select which transformer is active (1 active only at a time)
Define Confidence Factor Set to be used for EACH Transformer
Ability to hide displays
Segments
Define
Confidence Factor Set to be used for EACH segment
Change direction of segment left-to-right or right-to-left
Set number of phases for loads for EACH Segment
Coloured displays user definable
Ability to hide displays
Nodes
Define
Confidence Factor Set to be used by ALL Nodes
Coloured displays user definable
Ability to hide displays
Text
Add
text to diagram
Fully Customisable text bold, italic, font size, font type etc
Print
Preview
Preview
Report before printing
User definable fields
System print with or without legend/logo.
Conductor print lists with user definable fields
Transformer print lists with user definable fields
Costing print cost/metre of each Segment
Result Summary tabulated Node Voltage by path
Utility
program
Built-in
function
Custom list of conductors/transformers
Define conductor type, temperature, $/m, resistance and reactance
Load old .dat format files and resave as new .xml files for use
in LVDrop6
Options
Set
multiple defaults transformers, conductors, loads
Two Confidence Factor Sets
Change Node/Segment display colours
Set logo path for use on report prints
Help tab link to manual
Study
Details
Define
Study Title, Company, Author of study
Set date
Add comments to be saved to file
XML
File Format
New
file format
Structured, easy to read
DataShare
Live Update
Get updates through the website
Excerpt from Calculating Voltage Rise paper by Andrew Thomas (Ergon))
1. VOLTAGE RISE
The chief quality of supply problem for small scale PV connections is over-voltages due to voltage rise. As current unity power factor inverters used in the majority of PV connections do not have voltage control capability, they will attempt to match their output power to their input power from the panels, thereby allowing the connection voltage to rise until an over-voltage cut-out limit is reached. While connection standards specify an over-voltage cut-out of no more than 255V, many systems in practice are being found to have cut-out voltages up to 265V, thereby creating the possibility of equipment damage. In any case, because customers invest a substantial amount of money in their PV systems, if voltage rise is of a magnitude to cause frequent inverter cut-outs, said customers will not be making a return on their investment through the feed-in tariffs.
Therefore, it is vital that PV created voltage rise is quantified so that proper assessments of customer applications for PV can be made. The following sections detail a proposed calculation methodology for PV voltage rise and outline the expected rises within Ergon Energy’s distribution network. The following sections will mostly focus on voltage rises within the LV network, as this is where the considerable majority of rise will occur.
1.1. Calculating voltage rise
The following briefly details the derived formula. Using the assumption of a uniform distribution of customer numbers along an LV feeder, and ignoring for the moment the neutral conductor, the voltage rise in a small segment of LV due to a single PV system, at a distance x from the distribution transformer is:
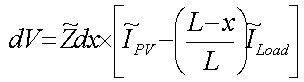
Where IPV is the current due to the PV system (either three phase or single phase) and ILoad (either three phase or single phase) is the total current due to the load on the LV network, with both currents being calculated at nominal voltage. The impedance Z is in ohms per unit distance and L is the total length of the LV run/feeder. It is here assumed that the location of the PV system is greater than or equal to x from the transformer.
|